
The latest UX and product design statistics suggest that many digital products fail not because they lack features, but because users cannot find what they need quickly enough. Whether it’s poor onboarding, confusing navigation, unclear workflows, or friction during key interactions, small usability issues can have a significant impact on adoption and retention. The statistics in this article highlight the factors that most influence user behavior, from first-session engagement and task completion to conversion rates and long-term retention, helping explain why some products succeed while others struggle to gain traction.
User Adoption & Retention
User adoption and retention are often the strongest indicators of long-term product success. These UX and product design statistics highlight how user experience influences first impressions, purchasing decisions, and customer loyalty.
- Users form an opinion about a website and its credibility in as little as 50 milliseconds during their first visit.
- Every $1 invested in UX returns an average of $100 in ROI across measurable business outcomes.
- Companies that prioritize design outperform industry benchmarks by 219% over a 10-year period on average.
- According to recent ux and product design statistics, 88% of users are less likely to return to using the product after a poor user experience.
- Improving UX can increase customer retention rates by up to 15% across multiple industries and sectors.
- 73% of customers say their overall experience influences purchasing decisions when evaluating products and services.
- Organizations focused on customer experience report revenues that are 4% to 8% higher than their competitors in the industry.
- Nearly 70% of online businesses fail because of poor usability rather than competition in the marketplace.
Why Digital Products Fail
Many digital products fail despite having strong features and capable development teams. In many cases, the underlying issue is poor user adoption, weak onboarding, or a lack of alignment with actual user needs.
- Approximately 42% of startups fail because their product solves problems that did not exist in the market.
- 55% of users spend fewer than 15 seconds on a website before leaving without any meaningful engagement.
- In many industries, the average app retention after 30 days falls below 10% among active users.
- More than 80% of software product features are rarely or never used by customers regularly.
- More than 70% of mobile apps are abandoned within the first 90 days of installation.
- 21% of users tend to abandon an app after using it only a single time.
- Poorly made onboarding experiences lead to 77% of users abandoning the app within the first 3 days of using it.
Product-Market Fit and User Behavior
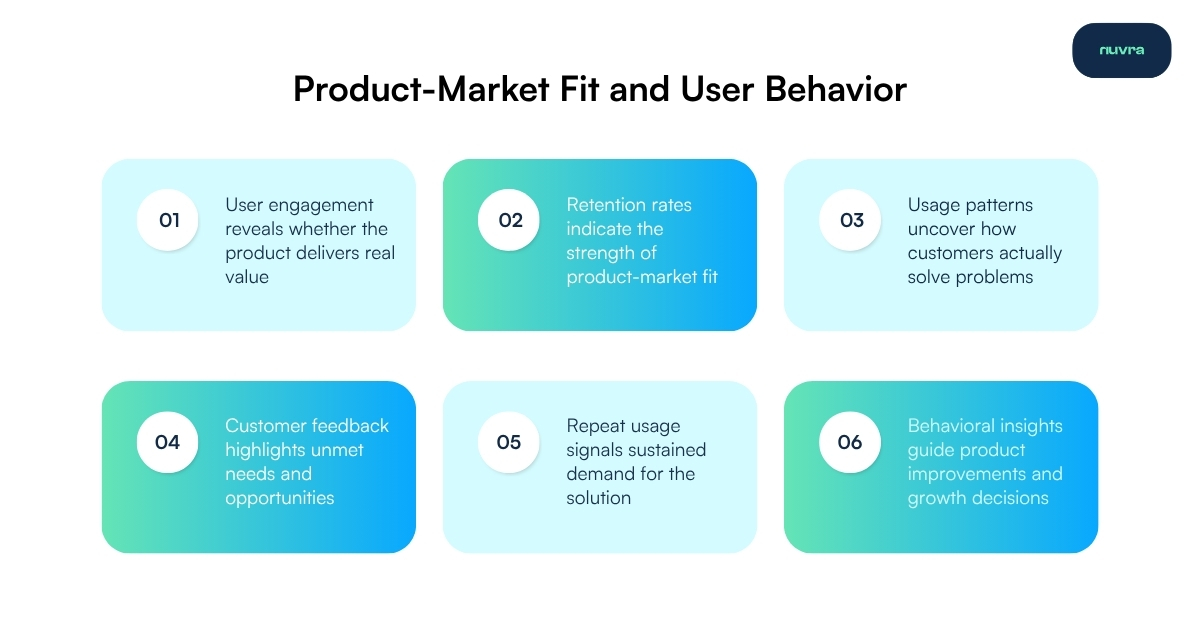
Understanding user behavior is essential for identifying whether a product truly solves a meaningful problem. These UX and product design statistics highlight the relationship between customer experience, research, profitability, and long-term growth.
- Nearly 32% of customers stop doing business with a brand after a single bad experience even if they like the product.
- As many as 85% of customers are willing to pay a premium for their product for a better customer experience.
- Nearly 50% of consumers tend to make impulse purchases after receiving a more personalized experience with a company.
- Businesses that conduct regular user research and regularly update their website based on it are 1.9 times more likely to report improved customer satisfaction levels.
- Organizations with mature customer experience programs achieve revenue growth rates that are 41% faster than their competitors in the market.
- According to recent ux and product design statistics, customer-centric companies are 60% more profitable than companies that are not customer-centric, a direct correlation between revenue and customer satisfaction.
- Companies with mature design practices grow revenue at nearly twice the rate than that of their peers
Conversion and User Trust
Small usability improvements can have a significant impact on conversion performance. These statistics demonstrate how trust, simplicity, and performance influence purchasing decisions and user behavior.
- Across industries, the average cart abandonment rate is approximately 70% for online purchases.
- As many as 22% of the users of an app abandon a purchase because the checkout process is too long or complicated.
- According to ux and product design statistics, as many as 53% of mobile users abandon pages that take longer than three seconds to load, showcasing the importance of faster load times.
- Reducing unnecessary form fields from 11 to 4 can increase conversion rates by up to 120% in some cases.
- In many cases, trust signals can increase conversion rates by more than 40%.
Onboarding and Activation
The first few interactions often determine whether users stay engaged or abandon a product entirely. These onboarding and activation statistics highlight the importance of helping users reach value quickly.
- Effective onboarding experiences can improve user retention by up to 50% over time.
- Personalized onboarding can improve activation rates by up to 20% for new users.
- As many as 63% of customers consider onboarding when deciding whether to subscribe to a product long-term.
- A study showed, companies that actively optimize activation rates regularly can increase long-term retention by more than 25%.
- Products with guided and personalised onboarding systems achieve activation rates up to 50% higher than products relying solely on self-discovery alone.
The statistics in this article point to a simple reality: product success depends on far more than features alone. Users need to quickly understand a product, complete important tasks, and experience value early in their journey. When usability and customer experience are overlooked, adoption and retention often suffer as a result. Organizations that continuously learn from user behavior and invest in improving the overall experience are typically better positioned for long-term growth. For teams looking to strengthen product performance, working with experienced partners like Nuvra can help turn user insights into meaningful business results.